On this page
- The shape of the thing
- Rule one: add before you subtract
- The pattern that made it easy: little JSON files
- The live half: asking Proxmox and Prometheus directly
- Writing HTML like it’s 2003 (on purpose)
- Buttons that can’t be hacked (because there’s nothing to hack)
- The digest is for coffee; the pager is for smoke
- What’s next
For a while, the most dependable thing my homelab produced was email. Every finished backup: an email. The Wednesday package check: an email. Cron jobs I’d forgotten writing: email, email, email. So I did what everyone does — I trained myself to delete anything from the lab on sight. Which works great right up until the one email that actually mattered goes into the same mental trash can as a week of backup receipts.
The fix wasn’t a better spam filter. It was an architecture decision: the lab gets to send me exactly one email per day — 8:30 in the morning, readable over coffee, with real buttons for the things that need me — plus a separate, jealously-guarded immediate lane for genuine emergencies. This post is the design story: the rollout rule that kept it from eating alerts, the tiny-JSON-files pattern that made it extensible, and two rabbit holes I did not expect to go down (email CSS is stuck in another decade, and the safest button turns out to be the most boring one). If you just want to run it, there’s a copy-paste playbook with the whole script.
The shape of the thing
Here’s the architecture in one picture: everything reports, one thing emails, and criticals skip the queue entirely.
And here’s what actually lands in my inbox. (This one is rendered from the companion playbook’s sample data, so the names and addresses are the example values — my real one looks the same, just nosier about specific machines.)
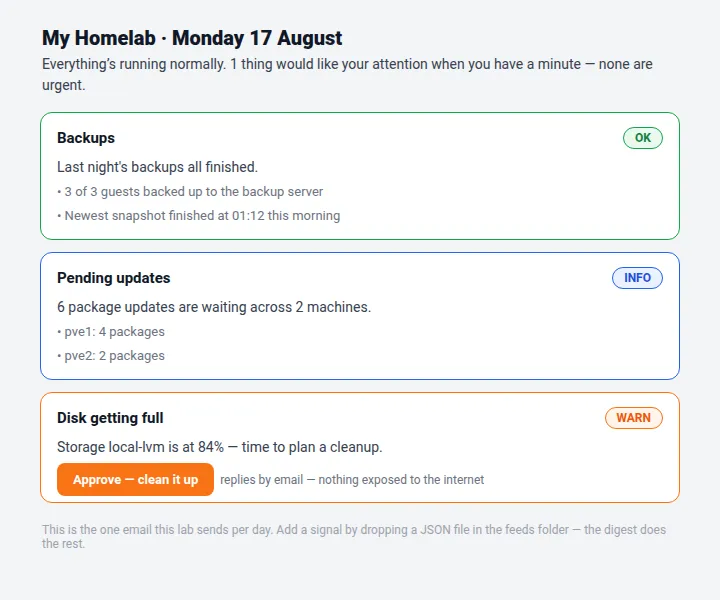
My favorite part is the verdict line. Most mornings it reads something like “Everything’s running normally. 3 things would like your attention when you have a minute — none are urgent.” That single sentence is the entire reason I open it: it’s either that, or a red banner — and because the digest only says “urgent” when something is genuinely on fire, I believe it.
Rule one: add before you subtract
Here’s the mistake I almost made, and the one thing I’d tell you to steal even if you ignore the rest: don’t silence anything until the new thing has proven it sees everything.
The tempting order is: turn off the noise (ahh, silence), then build the nice replacement at leisure. The problem is that the noise and the signal come out of the same pipes. In Proxmox VE, the email about a backup succeeding and the email about a backup failing are the same notification system — muting carelessly mutes both, and you find out during a restore.
So the digest went in additively. The old senders kept sending. The digest ran in --dry-run mode — gather everything, render the email, write it to a local HTML file, send nothing — while I compared it against live cluster state and the mail that was still flowing: same backup results, same alert states, same storage numbers. Only once the digest demonstrably captured every signal did the old senders get quieted, and even that is a scalpel, not a hammer: one severity-matcher command that drops routine info notices while warning and error events still email immediately. If you have the patience, let both run for a few days — the comparison costs nothing and catches the signal you forgot you had.
Everything machine-specific in this post is a placeholder, not a literal: you@example.com and family@example.com (recipients), 10.0.0.5 (a Prometheus host), /var/lib/digest-feeds (the feeds folder), pve1/pve2 (node names), local-lvm (a storage name), and the 08:30 schedule. If a value looks specific to one machine, it’s yours to change — and anything secret belongs in a credential store, never pasted into a script you might publish.
The pattern that made it easy: little JSON files
The digest has to collect state from jobs that run on completely different schedules — a weekly package check, a monthly restore test, a nightly image-update scan. My first sketch had the digest running all of those checks itself every morning, which is how you build a fragile 2,000-line monolith with the runtime of a kettle.
The pattern that saved it is embarrassingly simple: every producer writes one tiny JSON file, and the digest just reads whatever files exist.
A feed file is just this:
{"title": "Pending updates",
"status": "info",
"summary": "6 package updates are waiting across 2 machines.",
"lines": ["pve1: 4 packages", "pve2: 2 packages"],
"action": {"label": "Approve - install them",
          "subject": "APPROVE: apt upgrades",
          "body": "Approved - run the pending upgrades tonight."}}
The contract is deliberately tiny — title is the only required key, status picks the card color, action adds a button. Files render in name order, so a 10-/20-/90- filename prefix is the entire layout engine. In my lab, three producers currently feed it: the weekly apt check, the monthly restore test (proof the backups actually restore, not just that they ran — the backup server makes the backups, this proves them), and a nightly container-image check that runs on the NAS and gets read over SSH.
What I love about this pattern is what it does to future me. Adding a new signal to the morning email is not “modify the digest, test the digest, break the digest.” It’s: write a file. The digest never changes. And the failure containment came free: if a producer writes garbage, its feed renders as an orange “this feed could not be read” card. A broken producer becomes a visible fact in tomorrow’s email instead of a silent gap — the digest tattles on its own suppliers.
The live half: asking Proxmox and Prometheus directly
Feeds cover the slow-moving stuff, but “is the cluster okay right now” has to be fresh every morning. For that the digest asks two systems that already know.
First, Proxmox itself, through pvesh — a built-in command that exposes the Proxmox API on the command line, no HTTP client or API tokens needed when you’re on the node anyway. Two calls tell most of the story: /cluster/resources (every guest, every storage, every node, with usage numbers) and /cluster/status (is the cluster quorate — that is, do the nodes agree who’s in charge). A third sweeps recent backup task history per node, so a failed job shows up by name.
Second, Prometheus, which in my lab already scrapes everything worth graphing (that stack is its own post — the full Grafana + Prometheus setup). The digest calls one endpoint of its HTTP API, GET /api/v1/alerts, which returns every currently firing alert as JSON. If you’ve followed What Is Prometheus?, this is the payoff: every alert rule you ever write is automatically in tomorrow’s email, no digest changes required — same trick as the feed files, just live.
One design detail I’d defend in court: the two failure modes are different. Prometheus being unreachable doesn’t crash the digest, but it doesn’t get silently shrugged off either — it becomes its own card, because “the monitoring stack is down” is precisely the kind of news the one daily email exists to deliver. A monitoring pipeline that fails quietly is worse than no monitoring, because you think you’re covered.
Writing HTML like it’s 2003 (on purpose)
Then I went to make it pretty, and got the humbling I apparently needed.
The obvious way to build the template — the way I write every other scrap of HTML — is flexbox for layout and CSS variables for the palette. In email, the obvious way is a trap: the two big clients break your CSS in two completely different ways, and both are documented if you know where to look:
- Classic Outlook for Windows renders email with Microsoft Word’s engine. That’s not a rumor — Microsoft’s own reference for email developers opens by stating Outlook “uses the HTML parsing and rendering engine from Word” and then lists what that engine ignores:
float,position,background-image,max-width— and anything meaningfully newer than CSS 2.1, which is where flexbox, grid, and CSS variables live. (The new Outlook app renders like a browser, but you don’t get to choose what your recipients run.) - Gmail publishes a supported-CSS list and ignores everything off it. The official reference is refreshingly blunt: unsupported properties “may be ignored.” Custom properties — CSS variables — are not on the list.
So the digest’s renderer writes HTML the way it was written twenty years ago, deliberately: real <table> elements (with role="presentation" so screen readers don’t announce a data table), every style inline on every element, every color a hardcoded hex, and a system-font stack — -apple-system, Segoe UI, Roboto and friends — so the email uses whatever the reader’s device already considers normal instead of a web font that email clients won’t load anyway. There’s also a plain-text twin under the HTML (a multipart/alternative message) for clients and people who prefer it.
The one place I let myself have fun: color. Each subject area gets its own hue — green for backups, orange for alerts, blue for storage, violet for cluster state, pink for the knowledge-base tripwire, red reserved exclusively for “needs you today.” After a week your eye learns the map and reads the email like a dashboard: scan the left edge, done. It’s ugly source code producing a genuinely pleasant email, and I’ve made peace with that.
Buttons that can’t be hacked (because there’s nothing to hack)
The digest’s best feature is the “Needs you” card: plain-language title, one sentence of what happened, one sentence of what I recommend, and an Approve button. The morning email isn’t just a report — it’s an inbox-shaped to-do list where each item carries its own one-tap answer.
The interesting decision is what that button is. The obvious build is a link to some little web service — https://my-lab/approve?action=cleanup — and that obvious build is wrong twice.
First, it’s attack surface: a URL that does something when visited, reachable from my inbox, means a live endpoint to secure, patch, and worry about. Second — and this is the part I didn’t know until I read up — security scanners click links. Microsoft’s Safe Links documentation describes it plainly: URLs in incoming mail are scanned, rewritten, and ones without an established reputation are “detonated asynchronously in the background” — opened in a sandbox to see what they do. An approve link that fires on GET can be “approved” by a robot doing its job, before you’ve seen the email. One of the two addresses my digest goes to is a corporate inbox — exactly the environment where these scanners live — so this design question wasn’t theoretical for long.
So the buttons are mailto: links. Tapping one opens a pre-filled reply — subject APPROVE: storage cleanup, body already written — and nothing happens until a human presses send. No endpoint exists; there is nothing to scan, prefetch, or detonate. The consolidation added zero internet-facing surface to the lab, which for a homelab feature is my favorite spec line ever written.
One implementation footnote, because it cost me a confused half hour: mailto: URLs are governed by RFC 6068, which wants percent-encoding — spaces as %20, line breaks as %0D%0A. Python’s urlencode defaults to form-style encoding, which turns spaces into + — and mailto makes no promise about +, so some clients open your carefully-worded approval with plus+signs+everywhere. One argument fixes it (quote_via=quote); the playbook’s version has it baked in.
The digest is for coffee; the pager is for smoke
None of this works unless one boundary stays sacred: the digest is never the bearer of urgent news. The moment something time-critical waits politely for 8:30, the whole design is a liability. So the express lane from the first diagram has three tiny, boring, independent guards:
- The Proxmox severity matcher — the one-line fix from earlier — still emails
warninganderrorevents (failed backups, cluster errors) immediately. Silencing the successes never touched the failures. - A node watchdog pings every node every five minutes and emails only on transitions — down, or back up. No heartbeat spam, and it deliberately doesn’t depend on the monitoring stack it might one day have to report dead.
- A critical pager checks every ten minutes for the short list of things I never want to sleep through: any Prometheus alert tagged
severity=critical, any storage at 92% or more, any backup failure in the last day — deduplicated through a little state file so one incident pages once, not every ten minutes until fixed.
The thresholds are staggered on purpose: the digest starts mentioning a storage at 90%, the pager interrupts at 92. First it’s a line over coffee, then it’s a page — escalation with a courtesy warning. (Knowing which numbers deserve a page is its own skill; What If a Node Dies Tonight? is where I worked mine out.)
The honest postscript: some of my “senders” turned out to be already broken in ways the flood had hidden. Three of my four nodes had no working mail path at all — their alert mail was landing in a local mailbox on the node itself, which nobody has ever read — and the cluster’s notifications were pointed at an old address I’d stopped checking. Consolidating didn’t just reduce the noise; auditing the noise found the silence. Giving the one sending node a real mail path is its own ten-minute job: the msmtp + Gmail setup from this playbook.
What’s next
The whole thing — feed reader, Prometheus fetch, email-safe renderer, mailto buttons, --dry-run preview, cron line — is a single stdlib-only Python script, and the companion playbook installs it with two sample feeds so your first render works before you’ve written a single producer. Start additive: let it run alongside your existing noise for a few days, check it catches everything, and only then reach for the mute button. Your inbox — and more importantly, your trust in your inbox — comes back within a week.
Related posts:
- Proxmox Emails You After Every Backup — Here’s the One-Line Fix — the silencing half of this design: drop routine notices, keep failure mail instant
- Proxmox Backup Server: Automated CT and VM Backups with Deduplication — the system generating most of the mail worth digesting in the first place
- What Is Prometheus? Homelab Metrics and Alerts Explained — where the digest’s live alert feed comes from
- Proxmox Monitoring with Prometheus and Grafana: Full Stack Setup — the monitoring stack this email is the front page of
- Uptime Kuma: Dead-Simple Homelab Monitoring Before You Touch Grafana — the push-notification lane for simple up/down, before email enters the picture
- One Dashboard for Your Whole Homelab: Set Up Homepage — the pull version of this idea: one page you visit instead of one email that visits you
- Exit Code 137: Common Homelab Service Issues and Fixes — what to actually do when the digest’s red card arrives
- Three of My Four Nodes Couldn’t Send the Alert — the field note behind why only one node carries this digest’s mail
Sources: Proxmox VE — Notifications (Admin Guide), pvesh — Proxmox VE API shell, Prometheus HTTP API, Gmail supported CSS reference, Word HTML/CSS rendering in Outlook (Microsoft), Safe Links in Microsoft Defender for Office 365, RFC 6068 — the mailto URI scheme.
Comments
Comments are powered by GitHub Discussions — sign in with a GitHub account to join the conversation.