On this page
You follow a monitoring guide, install an exporter, and open its page — and there it is: hundreds of raw numbers that vanish and change the moment you refresh. The data exists, but nothing is keeping it, and nothing lets you ask “what was memory doing at 3 a.m.?” That gap — turning a live-but-forgetful page of numbers into stored history you can query and alert on — is exactly what Prometheus fills. This post explains what Prometheus is, the one word that makes it click (scraping), how it stores what it collects, enough PromQL to be dangerous, and how to write your first alert. It’s the collector half of the pair that starts with What Is Grafana? — when you’re ready to build the whole thing, Proxmox Monitoring with Prometheus and Grafana is the hands-on walkthrough.
What Prometheus actually is
Prometheus is, in its own words, “an open-source systems monitoring and alerting toolkit.” The most useful way to think about it is a time-series database that collects its own data. A normal database waits for something to insert rows; Prometheus goes out and fetches the numbers itself on a schedule, then “stores all scraped samples locally and runs rules over this data” — either to record new series or to raise alerts.
That clears up the most common beginner confusion. In a typical homelab monitoring stack, three separate things do three separate jobs:
- Small agents called exporters sit on each machine and expose its live numbers as a web page. The most common is Prometheus node_exporter, which reports CPU, memory, disk, and network for a Linux host at
:9100. It only ever shows right now — refresh and the old values are gone. - Prometheus visits every exporter on a schedule, reads that page, and stores the history — it’s the database, keeping each measurement over time so you can look back.
- Grafana connects to Prometheus, queries it, and draws the picture — it’s the screen you actually look at.
Prometheus is the orange box in the middle. Everything to its left is raw measurement; everything to its right consumes what Prometheus has already collected and stored.
The exporter only exposes a snapshot — the numbers as they are this instant, gone on the next request. It has no memory and no query language. Prometheus is what turns a stream of snapshots into history you can look back through, which is why you run one Prometheus for a whole fleet of exporters rather than the other way around.
Scraping: Prometheus comes to you
The word that unlocks Prometheus is scraping, and the surprising part is the direction. “Time series collection happens via a pull model over HTTP” — Prometheus reaches out to each target and reads its numbers. The target never sends anything; it just leaves a /metrics page sitting there, and Prometheus visits on a timer.
You hand Prometheus a list of targets — a host and port that expose /metrics — grouped into named jobs. On every scrape_interval it makes one HTTP request to each target and stores whatever it reads. The built-in default interval is one minute; most homelabs turn it down to 15 seconds. Here is the whole idea as a config file:
The addresses below are placeholders. 10.0.0.11 and 10.0.0.12 stand in for your own hosts running node_exporter, and localhost:9090 assumes Prometheus runs on the machine you’re configuring. If a value looks specific to one machine, it’s a placeholder to change — not a literal to copy.
global:
scrape_interval: 15s      # how often to pull each target; the default is 1m

scrape_configs:
- job_name: prometheus     # Prometheus scraping itself
  static_configs:
    - targets: ["localhost:9090"]

- job_name: node           # every node_exporter you run
  static_configs:
    - targets: ["10.0.0.11:9100", "10.0.0.12:9100"]
The pull model has a quietly useful consequence: because Prometheus is the one making the request, it always knows when a target goes missing. A machine that stops answering can’t hide — its silence is recorded as a special up metric set to 0. A push-based system can’t tell “healthy but quiet” from “dead and gone”; a pull-based one gets that distinction for free, and it’s the basis of the first alert you’ll write below.
Scraping assumes the target is running long enough to be visited. A backup script that runs for ten seconds and exits would never be caught. That single exception is what the Pushgateway is for — short-lived jobs push their result to it, and Prometheus scrapes the gateway instead. Reach for it only when you genuinely have batch jobs; for anything long-running, plain scraping is the rule.
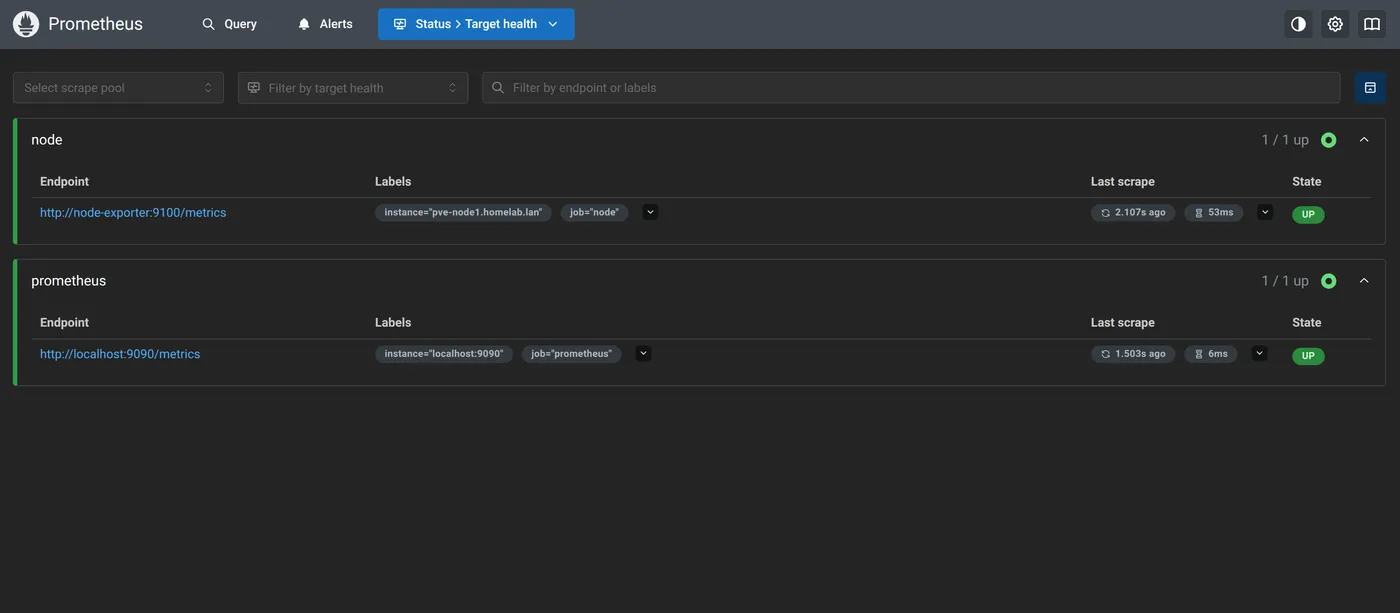
Prometheus ships with a bare-bones web UI, and the one page you’ll actually open is Status → Targets. It’s the “is my scraping healthy?” screen — every target, its job, whether the last scrape came back UP, and how long ago:
What Prometheus stores: metrics, labels, and time
Everything Prometheus keeps is a time series — and it’s worth 60 seconds to see exactly what one is, because it explains PromQL, dashboards, and alerts all at once. “Every time series is uniquely identified by its metric name and optional key-value pairs called labels.” The metric name says what is measured; the labels pin it to which exact thing; and the series itself is the stream of values over time.
Each sample in that stream is just “a float64 value” paired with “a millisecond-precision timestamp.” That’s the whole storage model: names and labels to find a series, then a long list of timestamped numbers inside it. The labels are what make it powerful — one metric name like node_filesystem_avail_bytes fans out into a separate series per filesystem per host, and you slice across them by matching labels. Hold onto that, because it’s exactly how you query.
PromQL, without the intimidation
PromQL is the language you use to ask Prometheus questions. It looks cryptic at first, but almost everything you’ll do early on is one of two shapes:
- An instant vector — “a set of time series containing a single sample for each time series” — the value of something right now, one number per series. Typing a bare metric name gives you this.
- A range vector — “a range of data points over time for each time series” — a window of recent values, which you ask for by appending a duration in square brackets like
[5m].
A handful of real queries covers most of what a beginner needs:
up
# 1 or 0 for every target — "which machines are alive right now?"

node_filesystem_avail_bytes
# free space on every filesystem of every host, one series each

rate(node_network_receive_bytes_total[5m])
# bytes/sec received, averaged over the last 5 minutes
That last one shows why range vectors exist. node_network_receive_bytes_total is a counter — a number that only ever climbs — so its raw value is meaningless on its own. Wrapping it in rate(...[5m]) measures how fast it climbed over a five-minute window, turning “total bytes ever” into the “megabits per second” you actually wanted. Counters plus rate() is the single most common pattern in all of PromQL.
Prometheus has its own Graph page that runs one PromQL query and draws one result — genuinely useful for exploring. What it can’t do is arrange dozens of pre-written queries on a single screen you revisit forever. That’s the job of a Grafana dashboard: the PromQL is still there, just saved inside each panel so you never retype it. Prometheus answers one question; Grafana shows you all of them at once.
Writing your first alert rule
Storing history is half the point; the other half is being told when a number goes wrong so you’re not babysitting a dashboard. An alerting rule is a PromQL expression Prometheus evaluates on a schedule — when the expression returns anything, that’s an alert. Rules live in their own files, referenced from prometheus.yml, and the canonical first one comes straight from the Prometheus docs:
groups:
- name: homelab-basics
  rules:
    - alert: InstanceDown
      expr: up == 0
      for: 5m
      labels:
        severity: page
      annotations:
        summary: "Instance {{ $labels.instance }} is down"
        description: "{{ $labels.instance }} of job {{ $labels.job }} has been unreachable for 5 minutes."
Read it line by line and it’s plain: expr is the condition (up == 0 — a target isn’t answering); for: 5m says it must stay true for five minutes before Prometheus counts it as firing; labels tag the alert with metadata like severity that decides where it’s routed; and annotations are the human-readable message, with {{ $labels.instance }} filled in per target.
The for clause is the part beginners skip and then regret. Without it, a single missed scrape during a reboot pages you instantly. With for: 5m, “Prometheus will check that the alert continues to be active during each evaluation for 10 minutes before firing” — swap in your own duration — and until then the alert sits in a pending state, visible but silent. Pending absorbs the flapping; firing is what reaches you.
Notice the split at the end: Prometheus raises the alert, but it doesn’t send the email. It hands firing alerts to Alertmanager, a separate service that “handles alerts sent by client applications such as the Prometheus server… deduplicating, grouping, and routing them to the correct receiver integration such as email, PagerDuty, or OpsGenie,” plus silencing and inhibition. That division is the one real difference from Grafana’s built-in alerting, which can email you directly — with Prometheus, raising and delivering are two jobs done by two services.
up == 0 is the ideal first rule precisely because Prometheus synthesizes an up sample for every target on every scrape, so the expression can never quietly return nothing. When you want the copy-paste version — the rule file, the prometheus.yml wiring, validation, and a hot-reload with no restart — the companion Your First Prometheus Alert Rule playbook has it end to end.
Where Prometheus fits in your monitoring
Prometheus is the collect-store-evaluate core of a small stack, and it pairs with the pieces around it rather than replacing any of them:
- Exporters sit below it — node_exporter and pve-exporter expose the raw numbers Prometheus scrapes.
- Grafana sits above it — it reads Prometheus as a data source and turns the series into dashboards you can read at a glance.
- Alertmanager sits beside it — it takes the alerts Prometheus raises and actually delivers them.
- Uptime checks answer the simpler “is it up?” question — that’s Uptime Kuma’s job, and it’s the right first monitor before you reach for metrics at all.
You don’t need all of it on day one. Most homelabs start with uptime checks, add Prometheus and Grafana once “is it up?” stops being enough, and wire alert rules only after they know which numbers actually matter.
What’s next
With the vocabulary in place, the hands-on builds are just filling in a shape you already understand:
- Proxmox Monitoring with Prometheus and Grafana — install the whole stack, from Prometheus to Grafana to email alerts.
- Node Exporter + pve-exporter: Complete Proxmox Metrics — stand up the exporters that produce the numbers Prometheus scrapes.
- What Is Grafana? — the viewer half of this pair, if you haven’t read it yet.
- Your First Prometheus Alert Rule — the copy-paste version of the alert section above.
The official Prometheus documentation is the reference to keep open once you start writing your own queries and rules.
Related posts:
- Home Assistant on a NAS: Why Placement Beats Hardware — Home Assistant exposes a /api/prometheus endpoint this scrapes
- What Is Grafana? Homelab Metrics and Dashboards Explained — the viewer half of this pair; Grafana draws what Prometheus stores.
- Proxmox Monitoring with Prometheus and Grafana — the hands-on build of the stack this post explains.
- Node Exporter + pve-exporter: Complete Proxmox Metrics — the exporters that produce the numbers Prometheus scrapes.
- Uptime Kuma: Dead-Simple Homelab Monitoring — the “is it up?” layer to set up before metrics.
- Homelab Capacity Planning: What If a Node Dies Tonight? — putting the history Prometheus records to work.
- Track AI Token Spend in Grafana: Claude, Codex, and Ollama — a real dashboard and alert built on this exact stack.
- Proxmox Emails You After Every Backup — Here’s the One-Line Fix — the severity filter Proxmox ships before you ever write an alert rule.
- One Homelab, One Email: A Daily Digest You’ll Actually Read — every alert rule you write here lands in one 8:30 am email via the alerts API.
Sources: Prometheus overview, Prometheus data model, Querying basics (PromQL), Configuration, Alerting rules, Alertmanager.
Comments
Comments are powered by GitHub Discussions — sign in with a GitHub account to join the conversation.