On this page
I ended up with three Ollama boxes almost by accident — one with a bit of GPU, two smaller ones for embeddings — and then spent weeks quietly annoyed at my own setup. Every tool I pointed at “my local AI” had to be told a specific node’s address. If that node was busy or down, the tool just failed; nothing rerouted. And no two nodes had the same models, so I kept a mental map of which box held which model. Three servers, zero coordination.
Olla fixes exactly that. It’s a small, fast proxy and load balancer that sits in front of your inference backends and gives you one endpoint — with health checks, automatic failover, a merged model catalog, and Prometheus metrics baked in. This is the first of a set of “next-level” homelab builds, and it’s the one I wish I’d deployed the day I added my second Ollama node. Everything below I ran on my own three-node cluster; the routing receipts and metrics you’ll see are real output.
Every address below is an example. Replace 10.0.0.61/62/63 with your own Ollama nodes’ IPs, and 10.0.0.20 with the host you run Olla on. Model names like gemma3:4b should be whatever you’ve actually pulled. If a value looks specific to one machine, it’s a placeholder to change — not a literal to copy.
What Olla is (and isn’t)
Olla is a load balancer and reverse proxy for LLM backends. It doesn’t serve models itself — your Ollama nodes still do that. Olla sits in front and makes several independent servers behave like one: it continuously health-checks each backend, merges their model lists into a single catalog, routes each request to a healthy node that actually has the requested model, and retries on another node if a connection fails. It speaks Ollama-native and OpenAI-compatible APIs, and — a genuinely nice touch — translates the Anthropic Messages API by default, so Claude-flavored tools can talk to your local models too.
If you run exactly one Ollama box, you don’t need this. The moment you run two, you do — because “which node do I point at, and what happens when it’s down?” is a question you shouldn’t have to answer by hand.
Deploy Olla
Olla ships as a single container image, so a small VM or LXC with Docker is all you need.
Pull and run the official image, publishing its port (40114 — “4-OLLA”, which made me smile). I use --network host so the built-in dashboard, which is loopback-aware, is reachable.
docker run -d --name olla --network host \
-v ~/olla/config.yaml:/app/config/config.yaml \
ghcr.io/thushan/olla:latest
Olla reads its config from config/config.yaml relative to its working directory — inside the container that’s /app/config/config.yaml. I first mounted mine at /etc/olla/config.yaml (a reasonable guess) and Olla silently loaded its built-in default instead, happily health-checking three backends I’d never configured. If your nodes don’t show up, check the startup log line Loaded configuration config=config/config.yaml and mount to that path.
The config is small. List each backend under discovery.static.endpoints, and pick a load-balancing strategy. I give my GPU node the highest priority so it’s preferred, with the two smaller nodes as fallbacks.
server:
host: "0.0.0.0"
port: 40114
proxy:
engine: "olla"
load_balancer: "least-connections"   # or: priority, round-robin
discovery:
type: "static"
static:
  endpoints:
    - url: "http://10.0.0.61:11434"
      name: "ollama-node1"
      type: "ollama"
      priority: 100
    - url: "http://10.0.0.62:11434"
      name: "ollama-node2"
      type: "ollama"
      priority: 90
    - url: "http://10.0.0.63:11434"
      name: "ollama-node3"
      type: "ollama"
      priority: 80
The three strategies map to three intents: priority (“always prefer the big node”), round-robin (“spread it evenly”), and least-connections (“send it wherever there’s the least in-flight work”). I run least-connections because my nodes are uneven and I’d rather chase idle capacity than a fixed order.
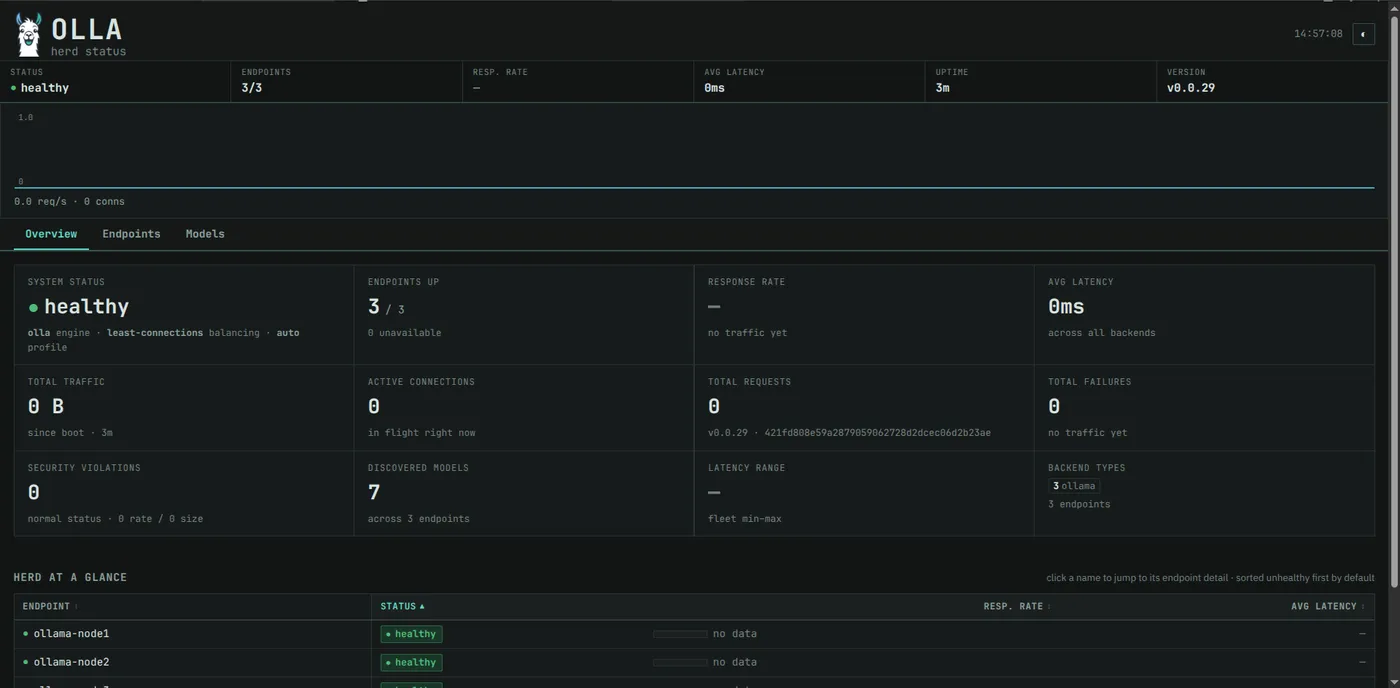
Olla’s /internal/status/endpoints shows each backend’s health and how many models it found. This is the real output from my three-node cluster:
$ curl -s localhost:40114/internal/status/endpoints
ollama-node1  healthy  models=5  http://10.0.0.61:11434
ollama-node2  healthy  models=1  http://10.0.0.62:11434
ollama-node3  healthy  models=1  http://10.0.0.63:11434
One catalog, and a receipt for every request
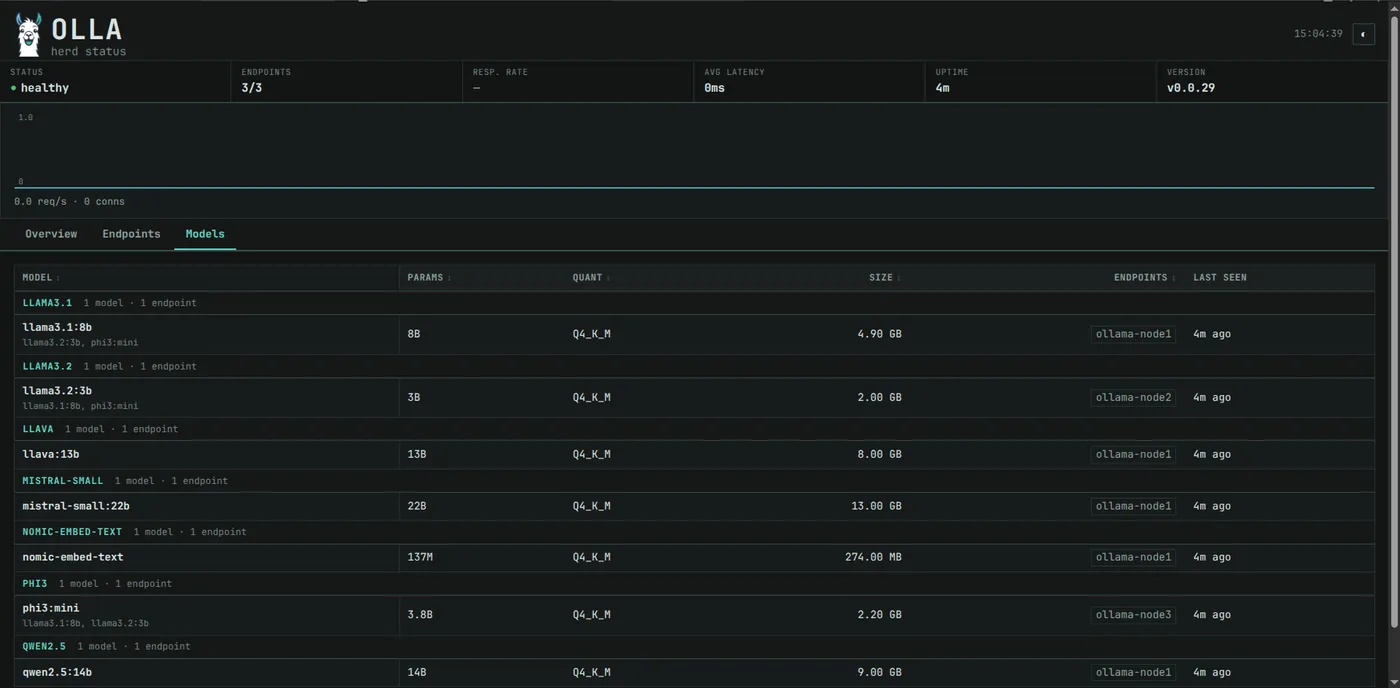
Two things make Olla feel like magic the first time. First, the unified model catalog: ask Olla for its models and you get every model across every node in one list, deduplicated — no more remembering which box holds which model.
The second is my favorite: every proxied response comes back with X-Olla-* headers that tell you exactly what happened. Here’s a real request I sent through Olla, asking gemma3:4b a trivial question, with the routing headers it returned:
$ curl -sD - localhost:40114/olla/openai/v1/chat/completions \
  -d '{"model":"gemma3:4b","messages":[{"role":"user","content":"Reply OK"}],"stream":false}'

HTTP/1.1 200 OK
X-Olla-Endpoint: ollama-node1
X-Olla-Model: gemma3:4b
X-Olla-Backend-Type: ollama
X-Olla-Routing-Decision: routed
X-Olla-Routing-Reason: model_found
X-Olla-Response-Time: 10674ms
...
{"choices":[{"message":{"content":"OK"}}]}
That X-Olla-Endpoint: ollama-node1 is Olla telling you, per request, which backend actually served it. When you’re debugging “why was that answer slow,” a receipt naming the node and the response time is worth a great deal.
The one thing that isn’t obvious: Olla proxies under a provider-prefixed path, not the bare API path. Use /olla/openai/v1/chat/completions for the OpenAI-compatible route and /olla/ollama/api/chat for the Ollama-native one. A plain POST /v1/chat/completions returns 404 — I probed my way to this, so you don’t have to.
Failover you can actually watch
Health checks are only interesting if something acts on them. Olla’s retry logic (retry.on_connection_failure, on by default) means that if the node it picked refuses the connection, it transparently tries another healthy node instead of failing the request. Pull the plug on a node and requests keep flowing; the model list shrinks to what’s left standing.
Wire it into Prometheus (no extra exporter)
This is where Olla earns its place in a monitored homelab: it exposes native Prometheus metrics at /internal/metrics, so your existing Prometheus scrapes it directly and you graph it in Grafana. No sidecar, no exporter. After my test requests, the counters looked like this:
$ curl -s localhost:40114/internal/metrics | grep '^olla_'
olla_endpoints_total 3
olla_endpoints_healthy 3
olla_requests_total 12
olla_model_requests_total{model="gemma3:4b"} 1
A one-line scrape job turns those into graphs and alerts — a panel for healthy-endpoint count (alert if it drops below your node total), request rate, and per-model usage so you can see which model your household actually leans on.
scrape_configs:
- job_name: olla
  static_configs:
    - targets: ["10.0.0.20:40114"]
  metrics_path: /internal/metrics
Olla’s read-only dashboard at /internal/ui/ is gated by an allow-list: a request must come from an allowed CIDR and present an allowed Host header. The defaults already permit the private ranges and localhost, so it loads over your LAN without fuss — but if the host sits on an untrusted network, tighten dashboard.access_policy.allowed_cidrs to just the addresses you trust.
The flourish: point Claude Code at your own cluster
Here’s the bonus that made me grin. Because Olla translates the Anthropic Messages API by default and gives you one stable endpoint, you can aim Claude-flavored coding tools at your local models — with failover across nodes — instead of a metered cloud key. For long multi-turn sessions there’s even opt-in sticky-session routing (sticky_sessions) that keeps a conversation pinned to the same backend so its KV-cache stays warm. One endpoint, three nodes, and your coding assistant never notices which one answered.
What’s next
You now have one address for “my local AI,” with failover and graphs behind it. Next in this run of flagship builds, I give my homelab itself an API an AI can safely read: a read-only MCP server that lets Claude query my cluster’s health, metrics, and boards — without ever being able to change a thing.
Related posts:
- Run an Ollama Cluster in Proxmox LXC — build the multi-node backend Olla sits in front of.
- Build a Read-Only Homelab MCP Server — the next flagship: let an LLM safely query your infrastructure.
- Give Your Local AI Private Web Search With SearXNG — another piece of the local-AI stack.
- Open WebUI: Advanced Setup — point a chat UI at your unified Olla endpoint.
- What Is Prometheus? — the metrics store that scrapes Olla.
- What Is Grafana? — where the endpoint-health and per-model panels live.
- Create Your First Proxmox LXC Container — a home for the Olla container.
Comments
Comments are powered by GitHub Discussions — sign in with a GitHub account to join the conversation.